



Today I’m sharing my updated my experiment planning tutorial and template, adding some extra help and guidance to avoid some of the pitfalls I’ve seen teams falling into over the last 12-18 months. Guaranteed to level-up your testing process!

I’m a big fan of how Crossbeam surfaces Ecosystem Qualified Leads (EQLs).
EQLs are prospects already buying from your tech partners. They convert faster and churn less than anything your funnel produces alone. Crossbeam brings that signal into your go-to-market stack and AI tools.
Check out their free playbook to get up to speed on how EQLs can boost your go-to-market efforts.

I’ve seen experiment plans from many teams over the years, and unfortunately I’ve seem many teams treat them as mere ceremony; documents that tick the boxes and make them feel good about their growth process. I’ve found that it’s pretty easy to tell how solid a teams testing process (and their broader growth process) is by looking at their experiment plans.
A great experiment plan template sets a high bar for product and growth teams to uphold the growth process and minimises the risk of costly experiment planning and execution errors.
In this post, I’m going to share the (now updated for 2026) experiment plan template that I’ve used and evolved as a product and growth leader, at Snyk, as well as with many of the companies I’ve advised over the years.
I’ll go through my template section by section and break it all down for you.

But before we get going, ask yourselves - “Do we really need an experiment for this?”
There are several reasons than an experiment might not make sense:
We have such high confidence in doing something that just moving forward with the implementation/scaling of an idea is low risk.
We don’t have enough traffic to this product surface area to make it feasible to run an experiment within a timeframe we feel is acceptable for learning
The questions we’re trying to answer more ‘why?’ than ‘what?’
We don’t have a well-informed and well-formed hypothesis.
For more on that take a look at the post below:

Assuming you determine an experiment is the right way forward…..Let’s dig in…
Summary & Learning Objective
Start with a clear, concise description of your experiment. Here’s a simple format to follow:
We want to [Change X] for [User Group U].
We hope to improve [Metric Y], and do no harm to [Metric Z].
When this experiment concludes, we hope to have learnt [Learning objective]
Why it’s important: This section sets the stage for your entire experiment, providing a quick overview for stakeholders and team members. It’s crucial because it:
Aligns everyone on the experiment’s purpose and scope
Clearly states what you’re trying to achieve and learn
Helps in quick decision-making by highlighting the key metrics you’re focusing on
Sets expectations for the experiment’s outcome
A well-defined summary and learning objective helps you stay focused throughout the experiment process and makes it easier to communicate your intentions to the wider team.
Hypothesis
Your hypothesis is the backbone of your experiment. It should be grounded in prior data, not just opinions. Use this format:
Null Hypothesis (H₀):
[Change X] will have no effect on [primary metric Y].
Alternative Hypothesis (H₁):
Because [evidence/observation],
We believe that [change X],
Will result in [expected direction and magnitude of change] to [primary metric Y].
Why it’s important: A strong hypothesis is critical because it:
Forces you to articulate your assumptions clearly
Helps people understand the ‘why’ behind the experiment
Ensures your experiment is based on evidence, not just hunches
Provides a clear prediction that you can test against
Aligns with proper scientific testing methodology
Reminds us that we’re gathering evidence against the null hypothesis, not directly “proving” our alternative hypothesis
Remember, great hypotheses are evidence-based. Link to research collections, analytics charts, or other supporting evidence. Think about your evidence in two parts:
The observation of the current situation (e.g. only 1.8% of users on this screen click the CTA), and
Why you think the test experience will change the observed situation (e.g. user research suggests that the CTA is not noticed, and a competing CTA that is more prominent is clicked by 16.4% of users)
In my experience, hypotheses that are grounded in solid evidence lead to accelerated learning.
Example:
Null Hypothesis (H₀):
Changing the location of the signup CTA will have no effect on signup conversion rate.
Alternative Hypothesis (H₁):
Because 98.2% of visitors to the homepage do not click on the CTA to sign up, and a competing CTA to book a demo is clicked by 16.4% of users, and recent observational studies suggest the signup CTA is rarely noticed,We believe that changing the location of the signup CTA to make it more prominently visible,
Will result in more visitors seeing and interacting with the CTA, increasing signup conversion rate from 1.8% to 10%.
Evidence
Elaborate on the evidence supporting your hypothesis. This might include analytics charts, session replays, user interview recordings, competitive analysis, or other market research.
Why it’s important: The evidence section is crucial because it:
Validates the basis of your experiment
Provides context for your hypothesis
Helps others understand your reasoning
Can highlight potential areas of post experiment investigation to better understand the reasons behind a given outcome
The more comprehensive your evidence, the stronger your experiment foundation. I’ve seen time and time again that experiments with well-documented evidence are more likely to gain stakeholder buy-in and lead to meaningful product improvements.
Experience
This is the part where you describe how users will experience the experiment.
Clearly define both the control and test groups:
Control Group: Summarise what the control group will experience. Include screenshots/designs
Test Group: Detail the experience for the test/treatment group. Again, screens are a must.
Why it’s important: Clearly defining the experience is critical because it:
Ensures everyone understands exactly what is being tested
Helps identify potential confounding variables
Provides a clear visual aid for implementation
Aids in interpreting the results by clearly showing what changed
Detailed descriptions of the control and test experiences help bring the test to life.
Targeting
Create a table outlining the following parameters:
Where: Which product surface will host the experiment?
Who: Which users will see the experiment?
When (assignment): When is the user allocated to a variant?
When (exposure): When does the exposure event fire?
How: How will traffic be split between test groups?
Assignment is not exposure
Assignment is the moment your system decides which variant a user is in. It usually happens early — on session start or page load — and that’s fine. Early assignment avoids flicker and keeps the variant stable across a session.
Exposure is the moment the user actually reaches the point where the control and test experiences diverge. This is the event that should define who enters your analysis.
Only exposed users belong in the analysis. If you count everyone assigned, and only a fraction of them ever reach the change, you’ve diluted your measured effect by that fraction. And because the sample you need scales with the inverse square of the effect you’re trying to detect, the traffic you need goes up roughly by the square of it. If only 10% of assigned users ever see the change, you need something in the order of a hundred times the sample.
Here’s the trap. Most experimentation SDKs log the exposure event at the moment you ask for the variant, not the moment the user sees it. So if you fetch the flag on page load to avoid flicker, exposure gets stamped at page load — even if the experiences don’t diverge until three screens later.
Easy way to check: does your exposure count look like the number of users who reached the changed surface, or like total sessions? If it’s the second, either defer the variant call to the divergence point, or turn off automatic exposure tracking and fire it manually where it belongs.
Two more things to verify:
The exposure event fires on both branches. One-sided exposure - common in redirect-style tests - looks like a broken traffic split and invalidates the comparison.
Nothing upstream is filtering who can be exposed at all. If you’re on a site with a consent banner and your analytics are consent-gated, your experiment population is “users who accepted tracking”, which is systematically not your user base. The randomisation is still valid - consent is decided before anyone sees anything different - so the result is real. But it’s a result about consenters, and you shouldn’t extrapolate the effect size to everyone.
Why precise targeting is important
It ensures you’re testing with the right audience
It helps control for variables that might skew your results
It allows for more accurate interpretation of results
It can highlight segment-specific insights
It determines, more than anything else in the plan, how much traffic you actually need
Well-defined targeting is essential to the integrity of your experiment.
Metrics
Clearly define the metrics that are relevant to your experiment.
Primary Success Metric: This is the ONE metric explicitly stated in our null and alternative hypotheses. The formal statistical outcome of the experiment (reject or fail to reject H₀) is determined solely by this metric.
Guardrail Metrics: These metrics are also analysed for statistical significance, but separate from the primary hypothesis test. A statistically significant negative impact on any guardrail metric may lead us to decide against implementation, even if we successfully reject the null hypothesis for our primary metric.
Monitoring Metrics: These provide additional context but won’t determine the experiment outcome. We don’t test them for statistical significance, and we don’t make decisions on them.
Why it’s important: This metrics framework is essential because it:
Provides clear success criteria for your experiment
Helps you understand the full impact of your changes
Allows you to catch any unintended consequences
Enables informed decision making
Distinguishes between statistical significance and business decision-making
Having this clear separation of metrics helps you make more balanced decisions about implementing changes post-experiment.
A word on testing lots of metrics at once
If you test enough metrics at a 5% significance level, roughly 1 in 20 will look significant purely by chance. Four guardrails plus a handful of monitoring metrics and you’re very likely to find something alarming that isn’t real - and in my experience it’s usually the scary-looking one that gets acted on.
Keep the guardrail list short and deliberate. Tighten the significance level if you have several of them. Never run significance tests on monitoring metrics at all.
Statistical Design
This section is crucial for ensuring your experiment’s validity. Include:
Baseline Data:
Primary Metric Baseline with time period
Standard Deviation (for continuous metrics)
Observed Patterns (weekly/daily variations)
Historical Context
Daily exposed users (how many users per day actually reach the point where control and test diverge)
Statistical Design:
Statistical Power (e.g., 80%)
Significance Level (e.g., 5%)
Minimum Detectable Effect (MDE)
Required Sample Size
Required and Target Runtime
MDE should be the same number as the smallest change that would actually be worth shipping. If your MDE is smaller than that, you can end up with a statistically significant result that isn’t worth the engineering effort - and you’ve already pre-committed to shipping it in your decision framework.
We follow the standard scientific approach of assuming the null hypothesis (H₀: no effect exists) and then determining whether the evidence allows us to reject this assumption.
Our decision rule:
If p < [significance level] for our primary metric: We reject the null hypothesis and conclude that our change likely has a real effect
If p ≥ [significance level] for our primary metric: We fail to reject the null hypothesis, meaning we don’t have sufficient evidence that our change has an effect
Use a statistical design tool (example) to help determine these parameters.
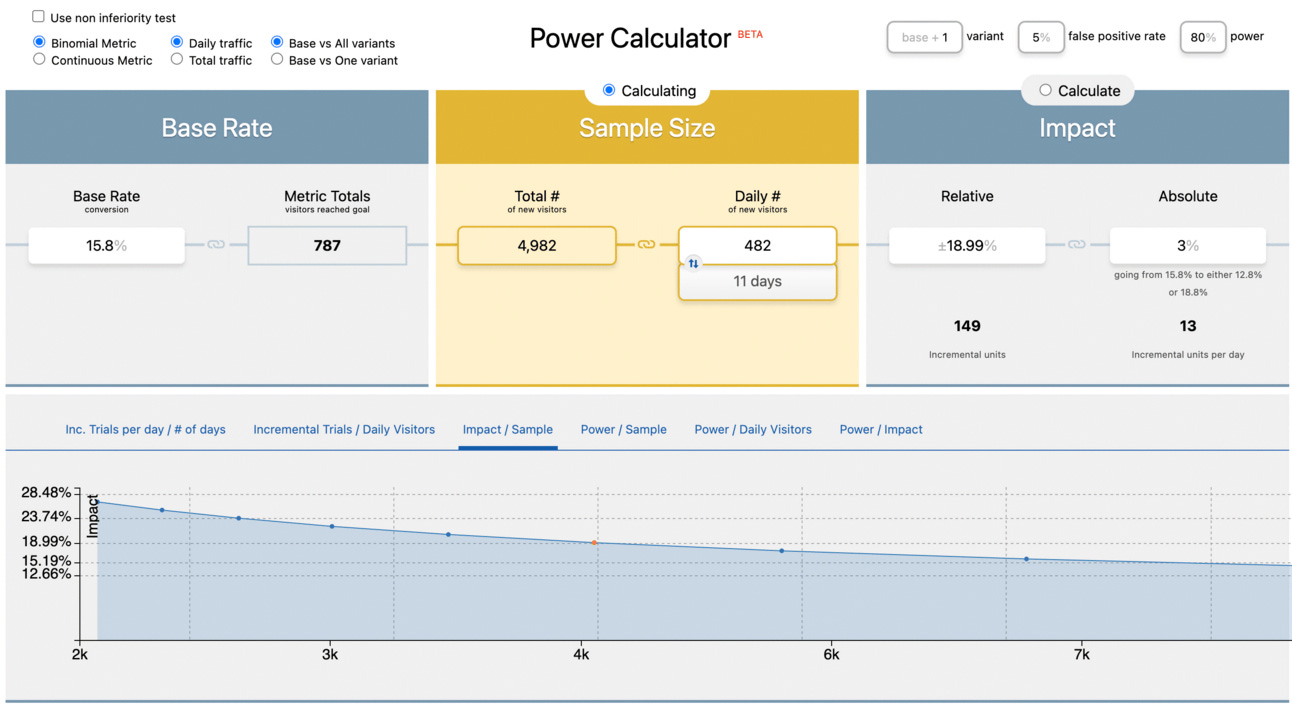
Why it’s important: Robust statistical design and baseline analysis are the foundation of any valid experiment because they:
Help you determine how long to run your experiment
Ensure you have realistic expectations for improvement
Allow you to detect meaningful changes in your metrics
Ensure you know when your results are statistically significant and not due to chance
Allow you to identify any abnormalities during the experiment
Increase wider confidence in your experiment results
If you don’t get this right, you’re very likely to be misled by data.
Stopping Rules & Interim Checks
Agree up front when you’re allowed to look at the results, and what would make you stop early.
When we look:
Checkpoint date - the date you read the primary metric and make a call
Interim checks - what you check before then. Health only (see section 9)
Early stopping method - none (fixed horizon), or a named sequential / always-valid method
Guardrail stopping rules - one row per guardrail:
The metric
The stop threshold - how far it would have to move
The sample needed to detect a move of that size
Who gets notified
Why it’s important:
Every time you look at a running experiment and consider acting on it, you get another roll of the dice on seeing a fluke. Look often enough and you’ll find one.
The significance level you set in section 7 assumes you look once, at the end. If five people are checking a dashboard daily, your real false positive rate is much higher than 5% - and nobody knows what it actually is.
If you genuinely need to read results early - and in a commercial setting you often do - use a sequential or always-valid method built for it. Peeking at a fixed-horizon test isn’t a method.
Note the third item in the guardrail list. If you don’t have the sample size to detect a drop of the size you’ve set as your threshold, that guardrail can’t do its job. Much better to know that in advance than to discover it mid-flight.
And agree the thresholds before launch with any stakeholder that may want to stop the experiment. If a guardrail moves by less than its threshold, that’s not a reason to stop - it’s noise. The whole point of writing the number down beforehand is that you can point at it later, when everyone is anxious and the temptation to act is strongest.
Pre-launch Checks
A short checklist, which should be completed before traffic ramps:
Both variants verified in production. Load each branch as a real user. (Verified in dev is not verified.)
Events firing and arriving in your analytics tool. Check the actual events, not just that the page loads.
Traffic split matches the design (check again 24 hours after launch.)
Nothing else launching on this surface in the same window. Including product deploys, not just other experiments.
Guardrail thresholds agreed with whoever owns the affected metrics.
Why it’s important:
A sample ratio mismatch is when the actual split doesn’t match what you asked for for example 53/47 when you specified 50/50. It means assignment is broken, and everything downstream is untrustworthy no matter how good the numbers look.
It’s a common silent killer of experiment validity, because nothing else looks wrong. The experiment runs, the dashboards populate, the numbers move. Check at launch, and check again during the run.
The rest of the list exists because I’ve watched teams lose weeks to a test that was never firing correctly, and then blame the idea rather than the instrumentation.
Known Limitations
What might make these results hard to read, or hard to generalise from? Write it in the plan, before you launch.
Common ones:
Measurement gaps - e.g. you can’t link variant to behaviour for users who don’t consent to tracking
Sample skew - e.g. this surface is only reached by returning users, so the result may not hold for new ones
Metrics you won’t be able to read at this volume - list them upfront
Anything else running in the same window - campaigns, seasonality, a price change
Why it’s important:
Stated up front, a limitation is a constraint everyone accepted. Produced afterwards, it sounds like an excuse.
Listing the metrics you can’t read at this volume is important to stop people arguing about them mid-experiment. If free-to-paid conversion can’t be read in a two-week test on a surface, everyone should be clear about that upfront so that when someone points at a wobble in it on day four, you’re not having the argument from scratch.
Decision Framework & Action Plan
Outline your plan for various outcomes:
Based on our statistical outcome, we will take one of the following actions:
If we reject H₀ AND guardrail metrics are unharmed:
Implement the winning variant
Document learnings and extend to similar product areas
Consider follow-up experiments to optimise further
If we reject H₀ BUT one or more guardrail metrics are harmed:
Do not implement
Analyse the trade-off between primary benefit and guardrail harm
Consider redesigning the solution
Document learnings
If we fail to reject H₀ with adequate sample size:
Do not implement the change
Examine segment data for potential effects
Consider iteration on the design
Document learnings
If we fail to reject H₀ with inadequate sample size:
Extend experiment or redesign with larger sample
Document learnings
If results show negative effect:
Do not implement
Document learnings about why the approach didn’t work
Plus a stakeholder communication plan: Who needs to know the results, when, how, and what key messages to communicate.
Why it’s important: A clear decision framework and action plan are vital because they:
Prepare you for all possible outcomes
Speed up decision-making post-experiment
Ensure you’ve thought through the implications of your results
Help align stakeholders on next steps before you even start
Distinguish between statistical outcomes and business decisions
Having this predetermined framework helps you move quickly from experiment results to implementation, significantly improving your product iteration speed.
Results
After running your experiment, document the outcome in these key sections:
Statistical Outcome:
Primary Metric Result for control and treatment
Absolute and Relative Difference
p-value and Confidence Interval
Statistical Decision (Reject H₀ / Fail to reject H₀)
Experimental Validity:
Was the experiment properly powered?
Did the traffic split hold?
Were there any external factors or technical issues?
Interpretation:
What does this outcome tell us about our original hypothesis?
How should we interpret the practical significance of the effect size?
What are the limitations of this experiment?
What unexpected insights emerged from the data?
Note: Remember that a statistically significant result (p < 0.05) does not “prove” our alternative hypothesis—it provides evidence against the null hypothesis of no effect. Similarly, failing to reject the null hypothesis does not prove that no effect exists.
Why it’s important: Thorough documentation of results is crucial because it:
Creates a record of what was learned
Helps inform future experiments and product decisions
Allows for knowledge sharing across the organisation
Provides accountability for the experiment process
Avoids common misinterpretations of statistical results
To avoid common misconceptions:
✅ DO say: “We have statistically significant evidence that the change affects [metric].”
❌ DON’T say: “We’ve proven our hypothesis.”
✅ DO say: “We did not find statistically significant evidence of an effect.”
❌ DON’T say: “We proved there is no effect.”
✅ DO say: “If there truly were no effect, seeing results this extreme would be unlikely (p = X).”
❌ DON’T say: “There’s a (1-p)% chance that our feature works.”
✅ DO consider both statistical significance AND practical significance (effect size).
❌ DON’T focus solely on p-values without considering the magnitude of the effect.
Well-documented experiment results become a valuable resource, informing product and growth strategy and helping you avoid repeating unsuccessful experiments.
Bringing it all together
By following this structure and understanding the importance of each section, you’ll create comprehensive, actionable experiment plans where each component plays an important role in ensuring your experiments are well-designed, executed, and leveraged for maximum impact.
Remember, the key to successful experimentation is rigour and clarity. Each section should be well-thought-out and clearly communicated. This not only helps your team execute the experiment effectively but also makes it easier to learn from the results and apply those learnings to future experiments.
In my time at Snyk, well-documented experiments were instrumental to our process of driving improvements to our growth metrics. They allowed us to make better decisions and continuously improve our product experience. As an additional benefit, they created a culture of experimentation where team members felt empowered to test their ideas and contribute to the product’s growth.
Get this foundational discipline right and you’re half way there.
PS: Get the full Notion template below - feel free to duplicate it and use as you wish!
Click here or on the image above to get the template.

Book a free 1:1 consultation call with me - I keep a handful of slots open each week for founders and product growth leaders to explore working together and get some free advice along the way. Book a call.
View the State of AI Search for Dev Tools 2026 benchmark report - 126,814 citation records across 1,075 representative tool-evaluation scenarios, 43 developer-tool categories, and five AI search platforms
View your free public Dev Tool AI Market Presence Report - 500+ dev tools across 47+ verticals and growing, all in the Dev Tool AI Search Landscape.
Sponsor this newsletter - Reach over 11,000 founders, leaders and operators working in product and growth at some of the world’s best tech companies including Paypal, Adobe, Canva, Miro, Amplitude, Google, Meta, Tailscale, Twilio and Salesforce.
Thanks again to our sponsor: Crossbeam
