

Bringing growth to life through a state model
Your product should not be a black box


I like the characterisation of product vs growth metrics that I first heard from Oleg Ya where:
Growth metrics answer questions about the overall state of the business
Product metrics answer questions about the product itself
And whereby the relationship between the two can be written as
growth metrics = f(product metrics, number of new users)
In my recent Minute Monday post on user growth accounting, I explained how xAU-style active usage metrics can be misleading because they are a function of the product’s ability to retain, AND the input of new users. In other words, by the above definition, they are a growth metric that needs corresponding product metrics (in this case, retention rate) to provide enough context to be meaningful.
Your product takes new users in, retains some of them, and churns some of them.
But that granularity of understanding is woefully insufficient; it’s just not actionable.
This is why it surprises me that more product and growth teams don’t take a more scientific approach and open up the black box to model what’s going on inside.
Bringing growth to life through a state model
Having more context about the specific levers available to you gives you essential insight that you can leverage in growth.
A product growth state model can be an incredibly useful tool in aligning the entire organisation around the work of product and growth teams. It can also inspire those in product and growth teams as they contextualise their work.
In its very simplest form, the model should show new, active, and dormant users/teams, and for any given period we want to count the number in each bucket:
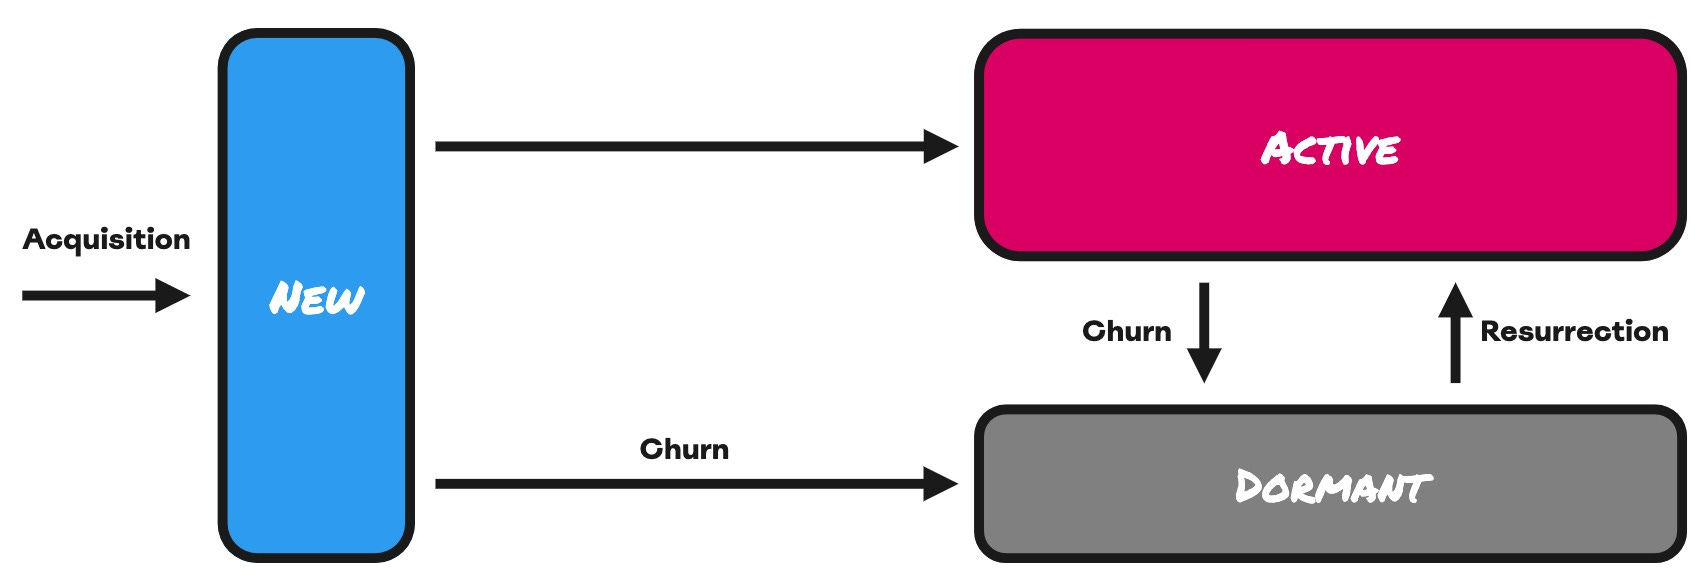
But what we really mean by ‘Active’ is not just the lowest common denominator of logging in, but rather something defined by users or teams experiencing the core value of the product. And we call this Engagement.
Activation & Engagement
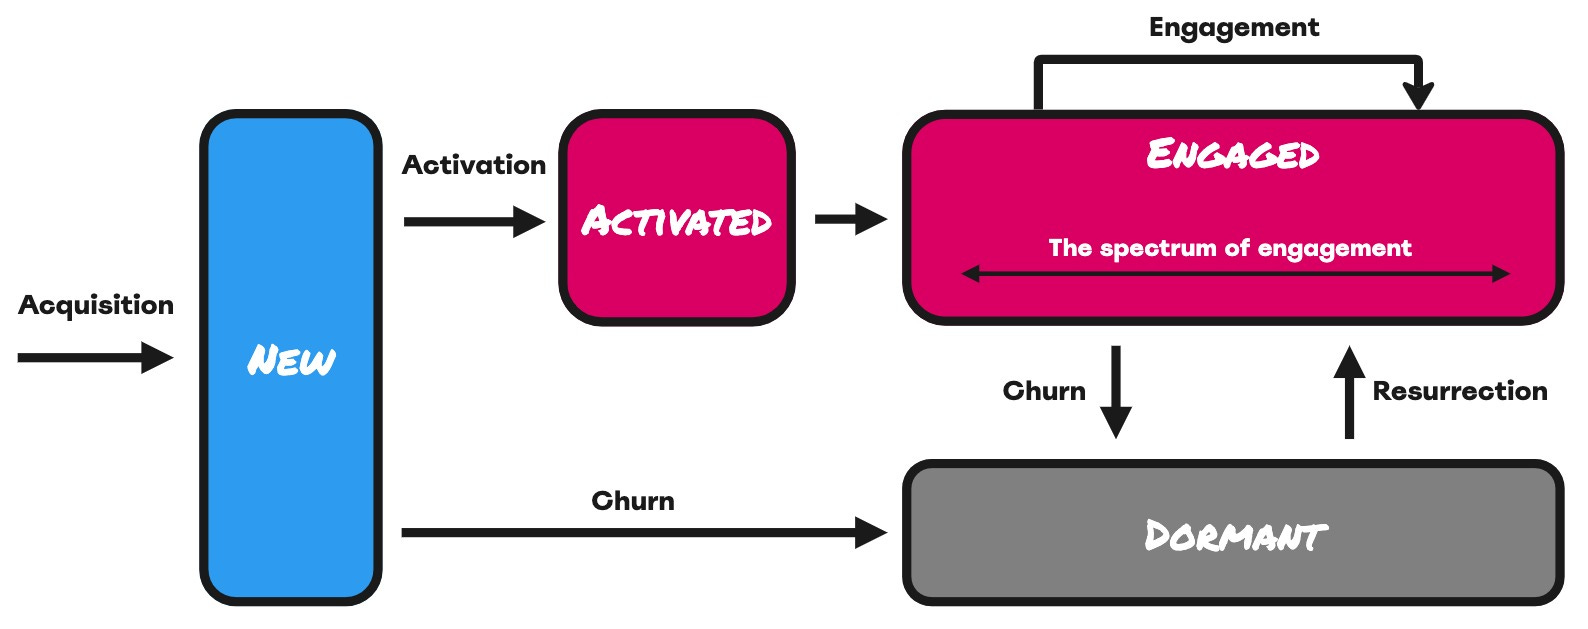
In order to keep users/teams engaged (and so by definition, retained), we attempt to activate them. This means taking them through the things they need to do to experience value (setup moment), getting them to experience that value (aha moment), and finally getting them to develop a habit around experiencing the value (habit moment). We know that users/teams who reach the habit moment are more likely to retain over time.
So we add this to our state model and we get this:
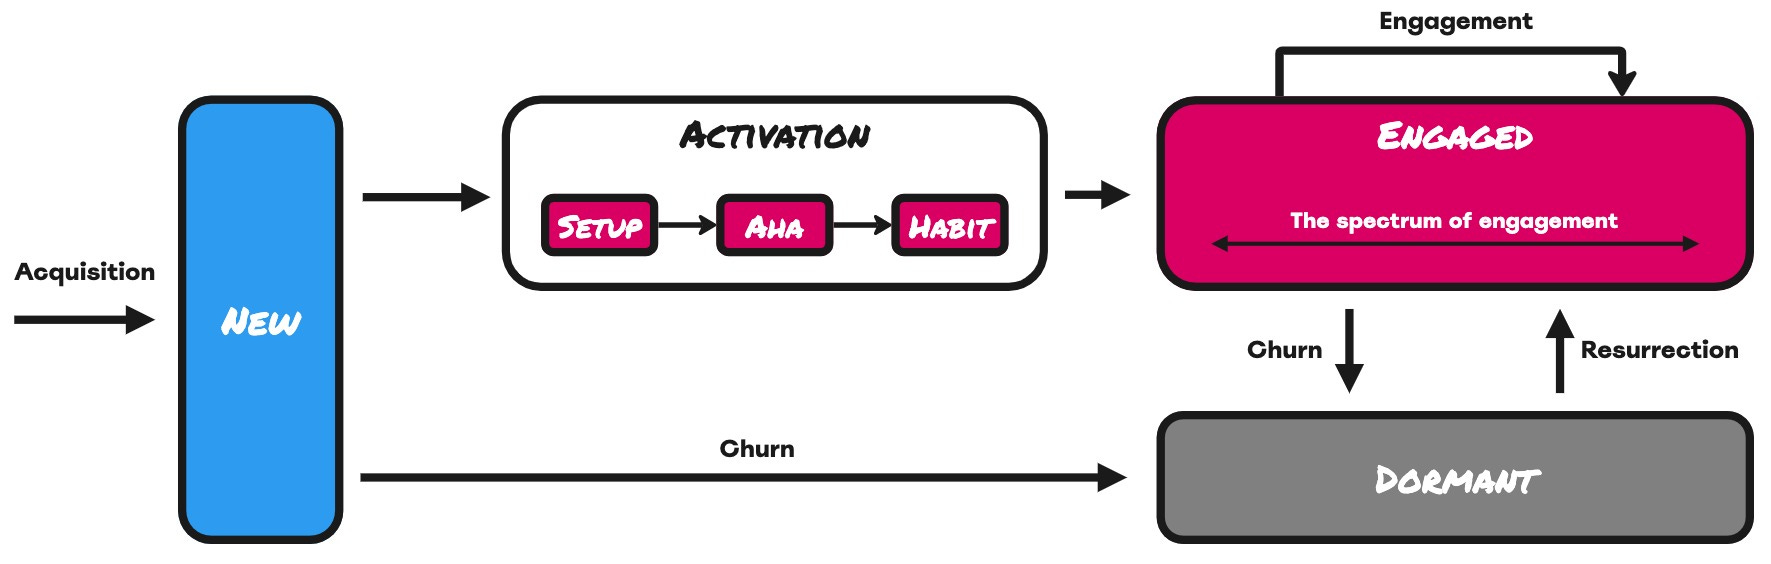
You can of course also break down the Activated bucket into those user/teams reaching setup, aha, and habit moments, and for teams focusing on improving activation, it’s incredibly important to have that nuance:
By definition, activated users/teams are also engaged, but for the purposes of accounting, I typically exclude this subset of activated and engaged users/teams who are new (in this reporting period) from the count of engaged users.
Engagement states
But remember from my post on measuring it, engagement is a spectrum, and we define engagement states to enumerate the degree of engagement of every user/team:
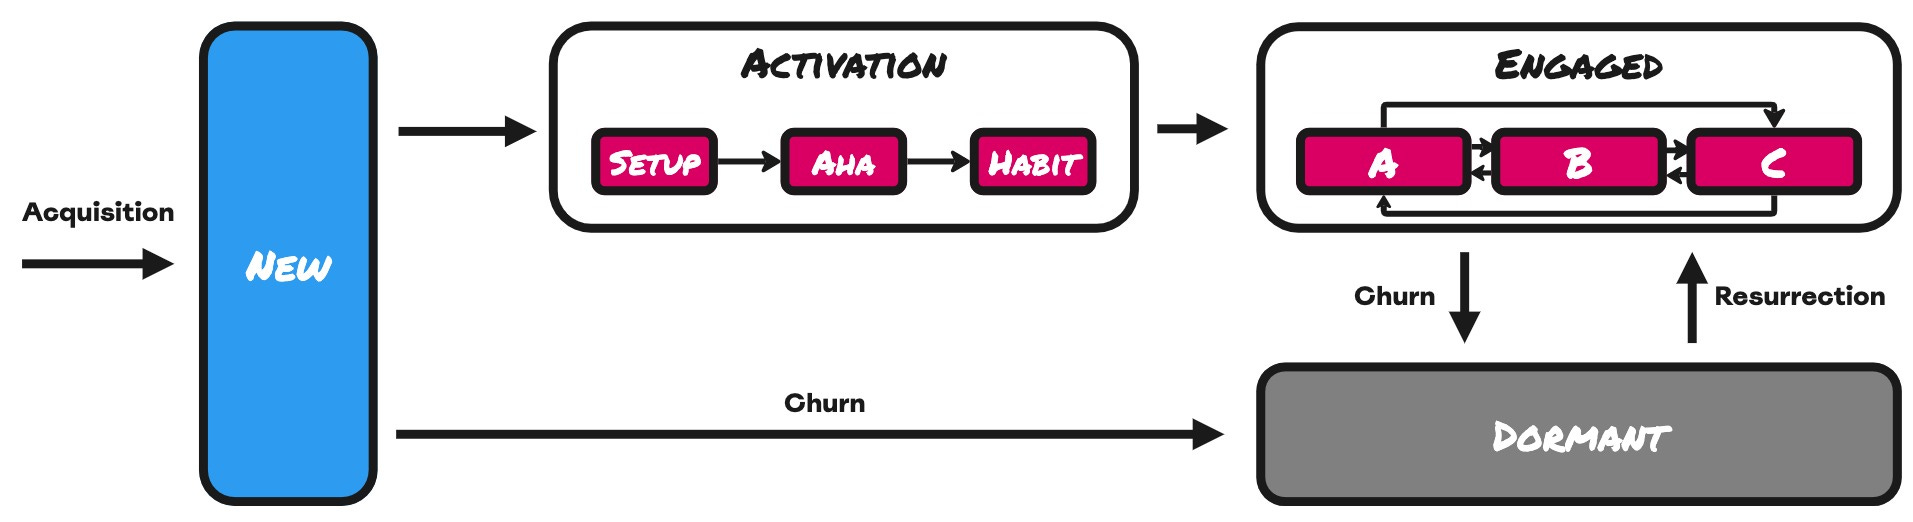
In this model, I just show 3 engagement states (imaginatively named A, B, and C). It’s not uncommon to have more. The definition needs to be right for your product.
In the context of engagement, from period to period, a user/team can
Move from activated into any (but one and only one) of the engagement states.
Move between any of the engagement states (eg A to C, or B to A, or A to C etc)
Move from any of the engagement states to dormant (churn)
Move from dormant to any of the engagement states (resurrection)
You can plot this over time to monitor the impact of initiatives to improve engagement mix:
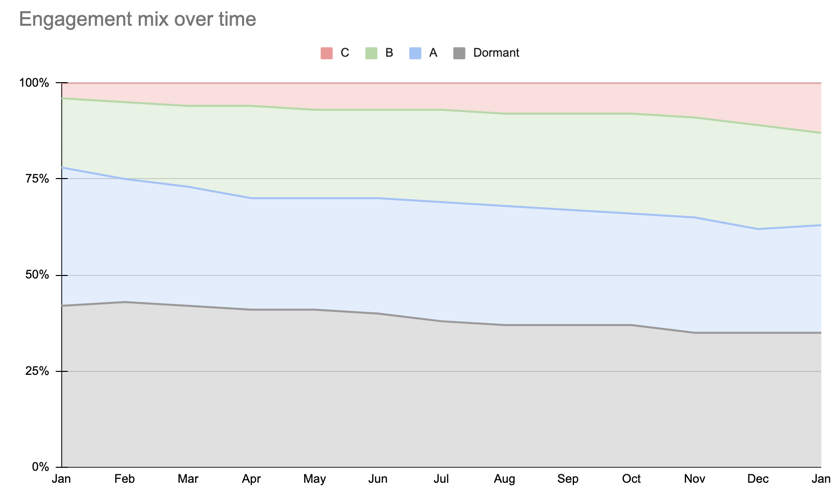
You’ll want to establish more granular visibility than this though. It’s good to know the overall engagement mix-shift, but better to understand how that mix-shift happens in any period
How many users/teams moved from A to B? How many from A to C? How many from B to A? How many from B to C? How many from C to A? How many from C to B? How many from A, B and C to dormant? How many from dormant to A, B, and C?
Model variables
Going further, you’ll need to establish all the key variables in the model so that you can track them over time:
New to dormant % (new user/team churn)
New to setup moment %
Setup to aha moment %
Aha to habit moment %
New to habit moment % (aka activation rate)
Habit moment to each of the engagement states %
% movement between each engagement state (bi-directional)
% movement between each engagement state and dormant (bi-directional)
Any engaged state to dormant % (engaged user/team churn)
Dormant to any engaged state % (dormant user/team resurrection)
Advanced: Given the model and the performance of all of its parts, you can build a sensitivity map that informs you of the highest and lowest points of leverage in the model, which is incredibly useful input into product and growth team prioritisation.
A few additional tips:
Segment activation rates, new to dormant churn rates, and engagement states by acquisition cohorts, to enable you to assess channel quality and bias acquisition efforts toward higher quality channels with good fit users/teams.
Engagement and user/org churn prevention are critically important. It’s easier to keep users/teams engaged than to resurrect them.
The resurrection of existing users/teams who have gone dormant can be impactful but should typically is more difficult, usually more costly, and should usually be a lower priority than keeping them engaged.
Todays listen:
Ken Norton - Leading with vision and purpose on Melissa Perri’s Product Thinking podcast
3 interesting reads:
Notorious PLG: Culture Building for PLS (Guest Post: Kenneth Vincent)
First Round Review: Webflow’s Path to Product-Market Fit with Bryant Chou
Tomasz Tunguz on Sales cycle increases in 2023
I love the framing of the state model! You got me at the high level, but the granular state model makes a lot of sense and shows the importance of building mechanisms into products to actually get this granular data in the first place. Thanks